
Venture capital is all about connections, but analyzing complex networks of investors, startups, and industries has outpaced older tools. Enter knowledge graphs - an advanced way to map and analyze these relationships. They reveal patterns like co-investing trends, founder success histories, and key network positions that drive investment outcomes.
Key insights:
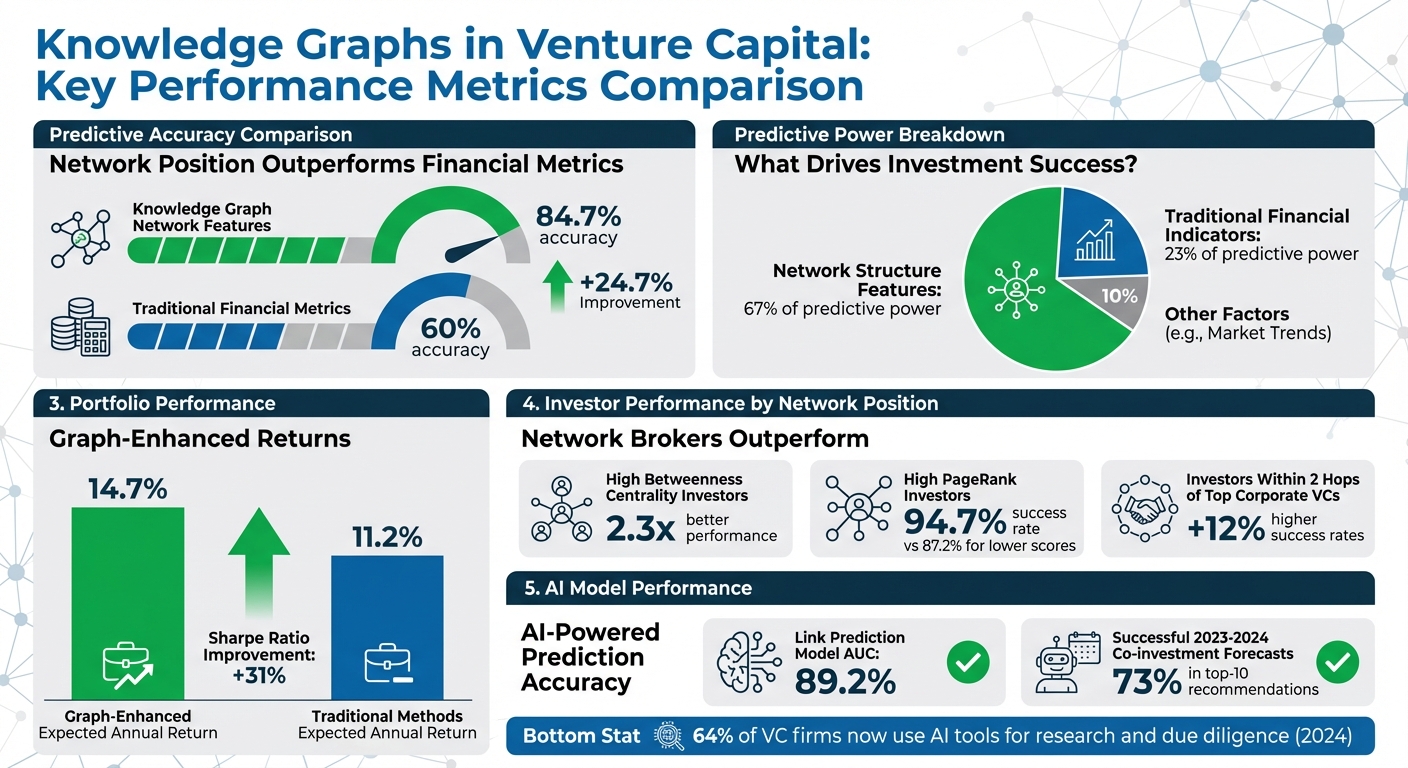
- Network position predicts success with 84.7% accuracy, outperforming financial metrics (60%).
- Investors with high "betweenness centrality" perform 2.3x better, connecting otherwise separate clusters.
- AI-powered knowledge graphs now automate deal analysis, cutting research time and improving predictions.
These tools are reshaping how venture capital firms evaluate opportunities, manage portfolios, and make decisions. Think of them as the next step in smarter, faster investment analysis.
Ignite Startups: The Hidden Power of Knowledge Graphs in Enterprise AI with Malcolm De Leo | Ep174
What Are Knowledge Graphs and How Do They Work?
Knowledge graphs are essentially databases that organize information as nodes (representing entities) and edges (representing relationships). In the world of venture capital, a node could represent an investor like Sequoia Capital, a startup like OpenAI, or a founder such as Sam Altman. Edges define how these entities are connected - for example, through an investment or a co-founding relationship.
This structure gives venture capital firms a powerful way to analyze their ecosystem. For instance, a company node might store details like "total_funding" or "industry", while an edge labeled "INVESTED_IN" could capture specifics like the amount invested, the date, and the funding round [1]. By following these connections, firms can uncover insights that traditional databases might miss. For example, tracing connections two steps away from a top-performing fund could reveal secondary investors who offer indirect advantages [1]. This interconnected view lays the groundwork for understanding the technical backbone of knowledge graphs.
"A knowledge graph provides a structured framework for integrating diverse data sources, representing complex relationships between entities (e.g., technology, teams, market trends), and facilitating nuanced valuation assessments." - Julian S. Thorne, Drexel University [2]
The Technical Foundation of Knowledge Graphs
Knowledge graphs rely on three main capabilities: data integration, relationship mapping, and dynamic updates. One of the biggest challenges is entity resolution - ensuring that different names for the same entity, like "Andreessen Horowitz" and "a16z", are merged into a single node instead of being treated as duplicates [1]. To solve this, venture capital firms often use machine learning algorithms to calculate similarity scores and deduplicate data across thousands of sources.
Once entities are correctly resolved, the graph captures relationships using various edge types, such as "CO_INVESTED_WITH", "FOUNDED_BY", "COMPETES_WITH", and "ACQUIRED_BY" [1]. Advanced systems can even model how these relationships change over time through temporal modeling. For example, in a study of the AI investment ecosystem conducted in July 2025, researchers tracked 11,234 edges spanning 25 years (2000–2025). During this period, clustering coefficients - a measure of network density - increased by 69% between 2015 and 2024 [1].
Knowledge graphs also support advanced analytics using algorithms like Betweenness Centrality, which identifies key investors acting as "brokers" between communities, and PageRank, which measures influence based on network connections [1]. These algorithms run continuously, updating as new data - such as funding announcements or executive changes - flows in, ensuring that the graph remains relevant and actionable.
Why VCs Need Knowledge Graphs
While traditional tools like spreadsheets or CRM systems can record basic details - like how much a firm invested and when - they struggle with more complex questions. For example, they can't easily answer, "Which co-investors consistently appear in our most successful deals?" or "How does proximity to top-tier corporate VCs impact exit outcomes?"
Knowledge graphs, on the other hand, thrive in this complexity. They excel at multi-hop traversal, making it possible to uncover patterns like "success cascades", where specific investor pairs repeatedly back winning startups [1]. This ability to model relationships and surface hidden patterns offers a strategic edge. Firms can map the "hidden architectures of success", using the graph to predict which deals are likely to outperform by analyzing the venture ecosystem as a web of interconnected data rather than isolated points.
How VCs Use Knowledge Graphs in Practice
Knowledge graphs transform abstract investment data into actionable insights, helping venture capital firms map ecosystems, predict syndicate opportunities, and forecast startup success with measurable precision. These tools are reshaping how firms approach market analysis, networking, and predictive modeling.
Market Mapping and Competitive Analysis
Knowledge graphs expose the hidden structure of markets. Instead of viewing industries as flat categories, they allow firms to extract detailed subgraphs, highlighting dominant players in specific niches. For instance, in July 2025, Jitesh Prasad Gurav dissected the AI investment ecosystem using a graph with 2,847 nodes and 11,234 edges spanning 25 years. By applying the Louvain algorithm, he uncovered seven distinct investment communities. The "Silicon Valley Tech Elite" cluster (e.g., Sequoia, Andreessen Horowitz) boasted a 97.2% success rate in infrastructure AI and enterprise applications. Meanwhile, the "Corporate Strategic Network" (e.g., NVIDIA, Google, Microsoft) achieved an even higher 98.9% success rate in platform AI and developer tools [1].
This level of detail surpasses traditional methods. While standard market segmentation uses 163 GICS sub-industries, advanced knowledge graph platforms now map over 1,000 proprietary sectors [5]. This enables firms to identify concentration risks and uncover untapped opportunities. For example, in AI, Autonomous Systems showed the highest network density at 0.35, with Toyota Ventures, NVIDIA, and GM Ventures as central players. In contrast, Natural Language Processing had a lower density of 0.28 [1].
Using betweenness centrality analysis, firms can pinpoint "network brokers" - investors who bridge different tiers and gain strategic information advantages. These insights help firms identify underserved areas with low competition but high potential, creating targeted strategies for capital deployment.
Investor and Syndicate Network Analysis
Market mapping clarifies industry dynamics, but understanding who invests with whom is just as critical. Knowledge graphs reveal co-investment patterns, showing which syndicate relationships consistently lead to success. The data is striking: investors with high betweenness centrality - those acting as bridges between communities - outperform their peers by 2.3x [1].
"Network position and relationship dynamics predict investment success far better than traditional financial metrics." - Jitesh Prasad Gurav, Towards AI [1]
Multi-hop relationship analysis adds another layer. Venture capitalists within two hops of high-performing corporate investors achieve 12% higher success rates than their more isolated counterparts [1]. This isn’t just coincidence - proximity to critical information and resources makes a difference. By visualizing these "influence paths", knowledge graphs help firms build key relationships early, well before deals are on the table.
Graph Neural Networks, such as GraphSAGE, take this further. Link prediction models have achieved an 89.2% AUC and successfully forecasted 73% of actual 2023–2024 co-investments in their top-10 recommendations [1]. This allows firms to anticipate future syndicate partnerships, shifting from reactive networking to proactive relationship building for a competitive edge in deal sourcing.
Predictive Modeling for Investment Outcomes
Knowledge graphs also power predictive modeling, using network insights to forecast investment success with impressive accuracy. Techniques like node2vec create 128-dimensional embeddings of investor and company nodes, feeding into models that outperform traditional approaches [1]. The impact is clear: investors with high PageRank scores - indicating global influence through network effects - achieve a 94.7% average success rate, compared to 87.2% for those with lower scores [1].
These graph-enhanced models boost portfolio returns by 3.5 percentage points over traditional methods [1]. Firms use them to rebalance portfolios, prioritize follow-on investments, and identify "positive anomalies" - startups that exceed expectations based on their network position.
Collaboration is also on the rise. Between 2015 and 2024, network clustering coefficients in AI investing grew by 69% [1], showing that success increasingly depends on collaborative networks rather than solo efforts. Platforms like StratEngineAI (https://stratengineai.com) now automate this process, generating detailed investment memos that combine network insights with traditional due diligence. Tasks that once took weeks now take minutes, enabling quicker, more informed decisions without compromising on depth.
Building and Managing Knowledge Graphs for VC
Creating and maintaining a knowledge graph for venture capital is far from a one-off task. It’s an ongoing effort that demands strategic planning, diverse data inputs, and robust technical infrastructure. The payoff? Knowledge graphs can predict investment success with an impressive 84.7% accuracy, compared to just 60% for traditional financial metrics [1].
Data Sources and Integration
A solid knowledge graph depends on a steady flow of high-quality, varied data. For venture capital, this typically involves integrating five key data categories:
- Firmographic data: Sources like LinkedIn, Crunchbase, and PitchBook.
- Technical data: Inputs from GitHub and patent registries.
- Market data: Insights from platforms like Reddit, Discord, and official filings.
- Operational data: Information from job boards and company websites.
- Financial data: Data from credit card transactions and CRM systems [1].
One essential step in this process is entity resolution - the practice of unifying different representations of the same entity. Using techniques like fuzzy matching and machine-learning-based entity linking early on can help avoid fragmented nodes and reduce the need for extensive cleanup later [1].
To keep the graph relevant, integrating temporal modeling is equally crucial. This allows you to track how investment relationships evolve over time, ensuring the graph reflects the dynamic nature of the market [1].
Graph Database Technologies
Once your data is integrated and entities are resolved, the next step is choosing a graph database. Platforms like Neo4j are particularly effective, offering advanced multi-hop relationship analysis that traditional relational databases struggle to handle efficiently [1]. These databases are also equipped to run algorithms like Betweenness and PageRank for centrality analysis, as well as the Louvain algorithm for detecting investment clusters [1]. Beyond just storing data, they enable real-time execution of these analytical tools.
Selecting the right database depends on your specific needs. For VCs handling sensitive deal data, striking a balance between performance and control is key. Closed-source databases may offer better performance, while open-source, self-hosted options provide greater control over your data [3]. Additionally, compatibility with machine learning frameworks is essential. Look for databases that support tools like graph embeddings (node2vec) and Graph Neural Networks (GraphSAGE) for tasks like link prediction and portfolio optimization [1].
"The goal isn't to automate judgment itself, but to automate many of the diligence functions involved in competitive analysis" — Tomasz Tunguz of Theory Ventures, as quoted in a Future Nexus analysis of the VC automation stack [3]
With the right infrastructure in place, automating these functions becomes a reality.
AI-Enhanced Knowledge Graphs for Venture Capital
AI-Driven Insights and Automation
AI is reshaping how venture capitalists analyze opportunities, turning knowledge graphs into dynamic tools that go beyond basic data storage. These graphs, powered by AI, now act as predictive engines capable of automating key due diligence tasks. For example, Graph Neural Networks (GNNs) like GraphSAGE can predict co-investment opportunities with an impressive 89.2% AUC score [1]. Instead of manually mapping relationships, AI pinpoints likely partnerships, giving venture capitalists a head start in sourcing deals.
Using algorithms like PageRank and Betweenness Centrality, AI can identify "network brokers" - investors who bridge sub-networks and outperform their peers by 2.3x [1]. These network-derived insights contribute 67% of the predictive power for investment outcomes, compared to just 23% from traditional financial metrics [1]. Tools like StratEngineAI (https://stratengineai.com) take this a step further by automating tasks like pitch deck screening and generating detailed investment memos. This reduces the time spent drafting memos from 12–15 hours to just 2–3 hours, all while maintaining high-quality analysis.
"Network position and relationship dynamics predict investment success far better than traditional financial metrics." - Jitesh Prasad Gurav, Data Scientist [1]
AI also handles tasks like deduplication, ensuring the knowledge graph stays accurate and reflects real-world connections. These automated capabilities lay the groundwork for even more advanced analyses when combined with large language models.
Combining Knowledge Graphs with Large Language Models
The integration of large language models (LLMs) with knowledge graphs takes data analysis to the next level. Frameworks like MIRAGE-VC simplify complex investment networks by using information-gain-driven path retrievers. These systems condense massive networks into manageable chains that LLMs can analyze step-by-step, resulting in a +16.6% improvement in prediction precision and a +5.0% increase in F1 scores for predicting venture capital success [6].
This setup enables detailed, multi-step reasoning across intricate networks, helping to build well-rounded investment theses. Instead of evaluating a startup in isolation, the system can trace connections like this: startup → founding team → past exits → co-investors → portfolio companies → market outcomes. This process allows for off-graph prediction, where AI synthesizes data on company attributes, investor histories, and network structures to forecast outcomes like a startup's likelihood of success [6].
Multi-agent architectures add another layer of sophistication, using learnable gating mechanisms to combine insights from various data sources. The system dynamically adjusts its focus depending on the startup's stage - prioritizing network position for early-stage ventures and financial metrics for later-stage deals [6]. This adaptive approach mirrors the nuanced strategies of seasoned venture capitalists but operates at a speed and scale only AI can achieve.
Metrics and Best Practices for Knowledge Graph Implementation
Clear metrics and thoughtful practices are essential to harness the full potential of knowledge graphs, ensuring they deliver measurable results and operational improvements.
Key Performance Metrics
The success of knowledge graphs can be effectively measured through predictive accuracy. For instance, network features achieve an impressive 84.7% accuracy in venture capital (VC) evaluations, compared to the 60% accuracy of traditional methods. Notably, network structure features contribute 67% of the predictive power in investment outcome models, while traditional financial indicators account for just 23% [1].
Portfolio performance metrics further highlight the advantages of graph-based methods. Graph-enhanced portfolio optimization demonstrates an expected annual return of 14.7%, surpassing the 11.2% achieved by traditional approaches. Additionally, the risk-adjusted Sharpe ratio improves by 31% [1]. In deal sourcing, link prediction models - used to identify potential co-investment partnerships - achieve an impressive AUC of 0.892 [1]. In 2025, 64% of VC investors used AI to accelerate researching companies, up from 55% in 2024 (Affinity), showcasing significant gains in operational efficiency.
These metrics underscore the ability of knowledge graphs to enhance decision-making in venture capital, providing both quantitative and operational benefits.
Implementation Best Practices
To turn these metrics into tangible outcomes, it's essential to follow best practices for implementing knowledge graphs.
Start by ensuring high data quality, which is critical for generating clear and actionable insights. Use fuzzy string matching with a Levenshtein threshold below 0.85 to resolve name inconsistencies across datasets [1]. Employ machine learning-based entity linking to maintain accuracy and prevent duplicate nodes as your graph scales.
Incorporate temporal modeling to track how relationships evolve over time. This helps identify market timing effects and performance trends, which are key for making informed decisions [1]. When designing your schema, include multiple node types - such as Investor, Company, Person, Industry, and Geography - and relationship types like INVESTED_IN, CO_INVESTED_WITH, and COMPETES_WITH. This structure enables in-depth multi-hop analysis [1].
Finally, adopt a phased rollout for implementation. Begin with high-impact, low-risk applications like deal screening and market research. Once these processes are refined, gradually expand into more complex areas like portfolio optimization. This step-by-step approach allows smaller VC teams to adapt smoothly while building confidence in the system, paving the way for smarter, faster decision-making powered by knowledge graphs.
Conclusion
Knowledge graphs are changing the game for venture capital firms, offering a fresh approach to evaluating opportunities and managing portfolios. By incorporating network-based evaluations, firms are now achieving far greater predictive accuracy compared to traditional metrics. This shift has allowed key investors to consistently outperform their peers [1]. Such advancements highlight a major leap forward in the way venture capital operates.
Transitioning from manual reviews to AI-enhanced knowledge graphs has completely reshaped due diligence processes. Sourcing has moved beyond the traditional reliance on warm introductions to using autonomous signal detection, which can pinpoint promising founders even before they formally establish their companies. Meanwhile, due diligence has evolved into a more rigorous process of "contradiction mapping", where AI agents cross-check founder claims against financial contracts and technical documentation. This continuous and dynamic analysis is transforming how firms evaluate potential investments [4].
Take platforms like StratEngineAI as an example. These systems harness AI to streamline tasks like pitch deck screening, creating traceable investment memos, and independently verifying strategies. What used to take weeks can now be completed in minutes. But the real value lies not just in adopting these tools - it’s in rethinking workflows entirely. By making structured data and relationship mapping the core of investment decisions, these platforms are setting a new standard for efficiency and precision in venture capital [4].
FAQs
What data is required to build a VC knowledge graph?
Creating a VC knowledge graph involves gathering a wide range of data that maps out the relationships and entities within the venture capital ecosystem. The foundation includes information about startups - such as their technologies, market sectors, and growth metrics - and details about investors, like their network connections, investment history, and strategic focus.
To make the graph comprehensive, you’ll need to incorporate elements like funding rounds, portfolio companies, founder profiles, legal documents, patents, and evolving market trends. A key aspect is integrating unstructured data - think pitch decks or legal documents - using natural language processing (NLP). This step allows for deeper analysis, which is critical for tasks like due diligence and evaluating investment opportunities.
How do knowledge graphs predict startup outcomes?
Knowledge graphs map out relationships between entities like technology, market trends, teams, and funding history, creating a framework to analyze patterns that influence a startup's success or failure. By combining graph algorithms with machine learning, these models reveal insights - such as how factors like network centrality or strategic partnerships align with growth trajectories. With their ability to achieve strong predictive accuracy, they empower venture capitalists to refine due diligence, evaluate risks in real-time, and make smarter investment choices.
How do I keep investor and company entities deduplicated?
To clean up investor and company entities in a knowledge graph used for venture capital analysis, focus on using unique identifiers like standardized IDs or corporate registration numbers. Combine this with entity resolution techniques - such as matching key attributes like name, address, and metadata - to merge duplicate records. The goal is to reduce redundancy while preserving data accuracy, which is critical for due diligence and evaluating potential deals.