
What the panel shows
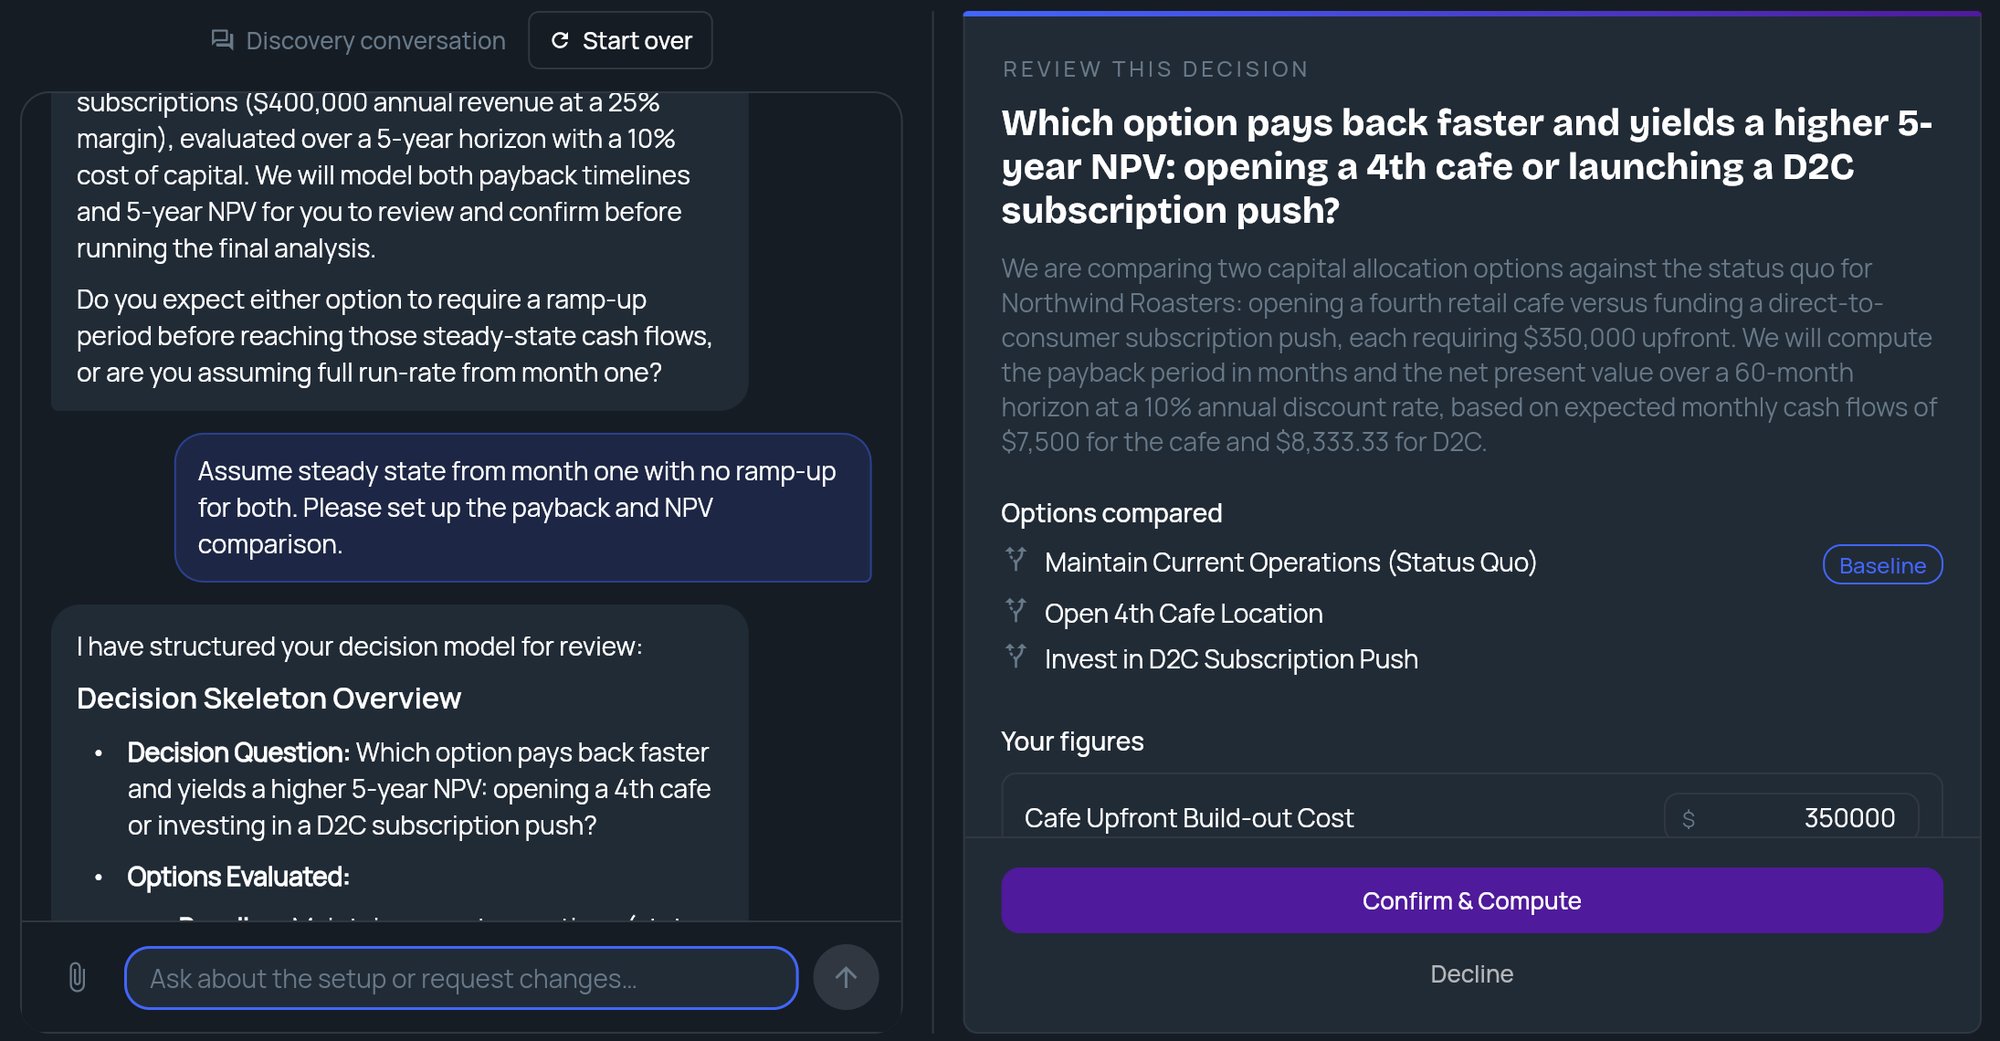
From top to bottom:
Each figure shows its unit, such as a dollar sign, /mo, % or months. Some also show the range the strategist thinks is plausible.
The calculations available include break-even, payback and net present value (NPV), and cash runway or affordability.
Edit figures and thresholds
Only figures shown in an input box can be edited. The strategist decides which ones those are. Everything else is shown as plain text and can’t be changed in the panel.- Edit a figure: type a plain number in its box. Commas are fine. Leave out currency symbols and units, since the box already shows them.
- Add a threshold: click Add threshold and type the rule in your own words.
- Remove a threshold: click the minus icon next to it.
Confirm or decline
1
Check the setup
Read the question, options and every figure, starting with Assumptions.
2
Correct what you can
Edit any figure in an input box and add or remove thresholds.
3
Confirm or decline
Click Confirm & Compute to run the numbers with the figures shown.Or click Decline if the setup is wrong. The panel closes and the strategist asks what to change, then can present a reworked version.
Read the results
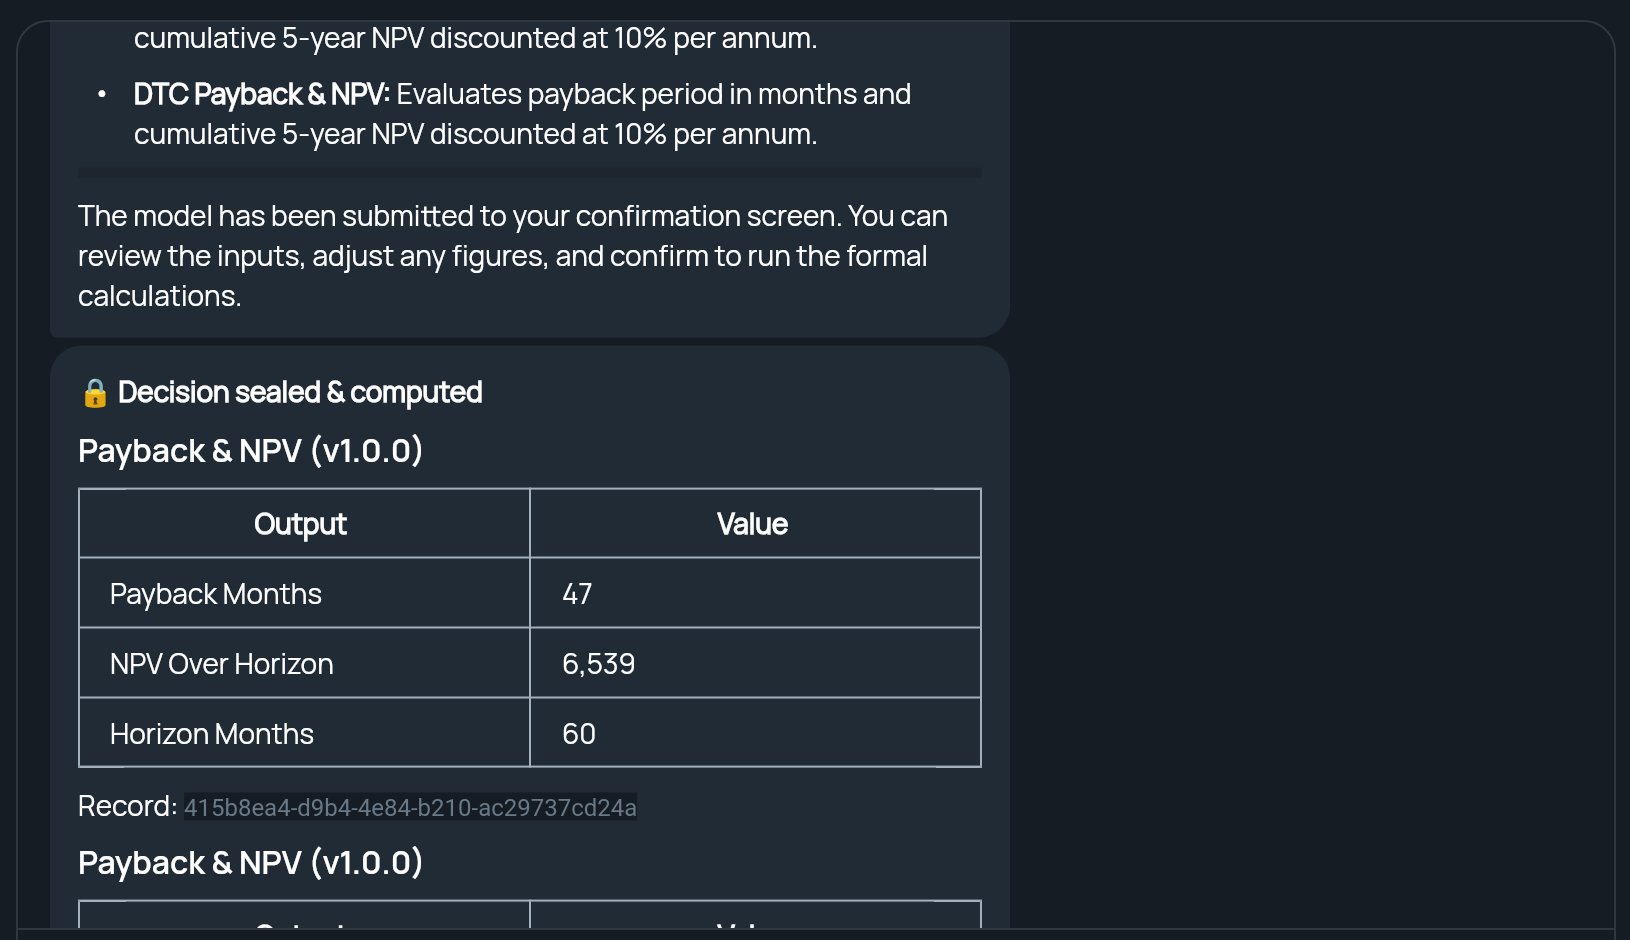
After you confirm, the panel closes and the results appear in the conversation under Decision sealed & computed:- A table of outputs for each calculation, such as payback in months and NPV over the time horizon.
- A sensitivity table, when there is one, showing the outputs at each value of the varied input. A point that couldn’t be calculated shows a warning in its row instead of numbers. That’s expected and doesn’t mean the whole result failed.
- A Record reference for each calculation.